Movicon.NExT Help on Line - Rel. 3.4.265
After having configured the server and deployed the project's graphical pages with the Deploy command you will be able to access and display the server project's data using the desired Web Client device such as:
PC Desktop or Laptop Browser
Tablet
Smartphone
The device will act as a "Thin Web Client" which will be authenticated and connected to the server when user points to the server's web address (URL) defined when deploying the pages as previously described.
When pointing to the server address, the startup page will be displayed on the HTML5 Web Client terminal.
Main Page command menu
The Web Client's Main Page has a menu on the top border which is used for accessing operating commands for some of the server project's features if provided.
The functions are described below:
Layout
This command calls the Web Client's main page. Therefore invokes the return to the main page.
Report
This command is used for viewing Data Report pages on the Client Web side if the Server project has been configured for managing them. This function therefore makes it possible to obtain reports via the web by accessing data recorded on the server to view its contents.
Alarms
This command calls the project's Alarm page and therefore to view active alarms and to perform operations such as sort by, acknowledge and reset also on the Web Client side.
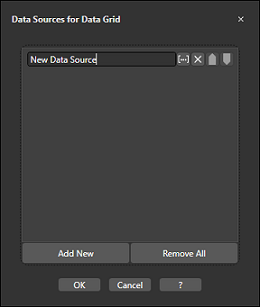
The Data Grid object is particularly useful for representing data in your projects in Grid format. When selecting the Data Grid object from the deploy window while using Microsoft SQL as a provider, for example, a dialog window will show allowing you to define the name of the Server and the Database to be used in order to create a connection string.
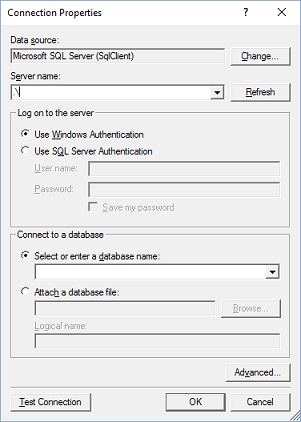
after having defined the your chosen provider you will be asked to enter the name of the server
At this point, insert the query for extracting data from the data source (img.2) in the 'Select' field. This list of data sources used in the project (img.3) will display in the previously opened dialog window.
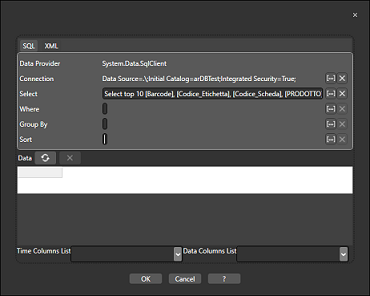
img.2
|
img.3 |
At this point when you go to publish your project on the WebClient you should see the connections dedicated to the specific objects,which also includes the Data Grid, on the bar at the top.
When you select the Data Grid Resource, all the data sources used until this moment will display. When selecting the data source desired, the data from the Database will be retrieved according to the query that you entered previously.
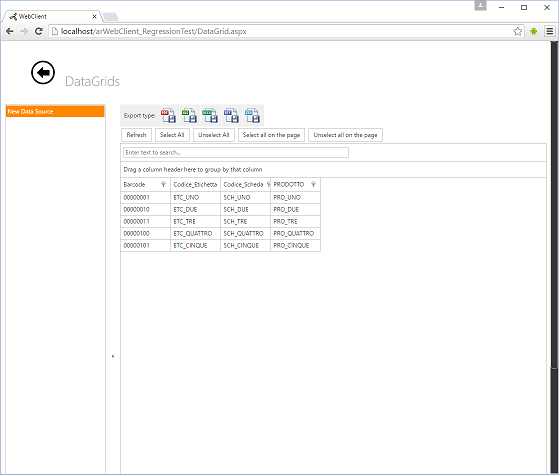
|
Data Filters can be created within this page in order to export them in various compatible formats. |
The Data Analysis objects are managed in the same way as described above but with 2 exceptions that need to be considered during the deployment procedures:
the first parameter in the select field (where the query is to be inserted) must always be a time column.
The fields after the query will be used to represent the chart's curves.
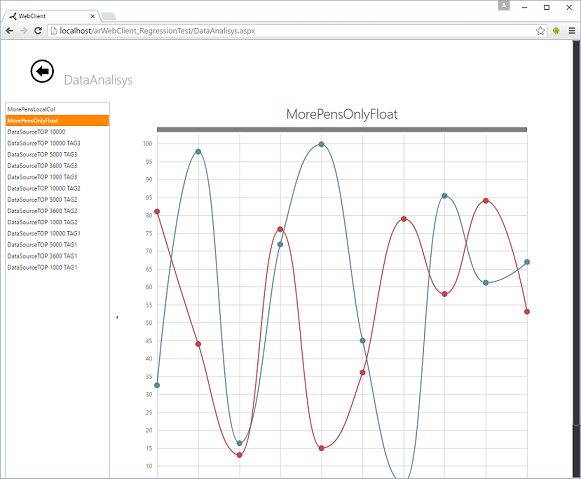
There are two calendar controls underneath the 'Date range picker' caption at the top of the page which can be used to apply a filter on data relating to the DataAnalysis within the time range defined in the initial query.
Data is loaded when the fetch button is pressed.
The DashBoard object is used to create a page or pages where different objects can be inserted (eg. Chart, Grid and Gauges) and connected to data sources. These Dashboards can also saved and reused for further use.
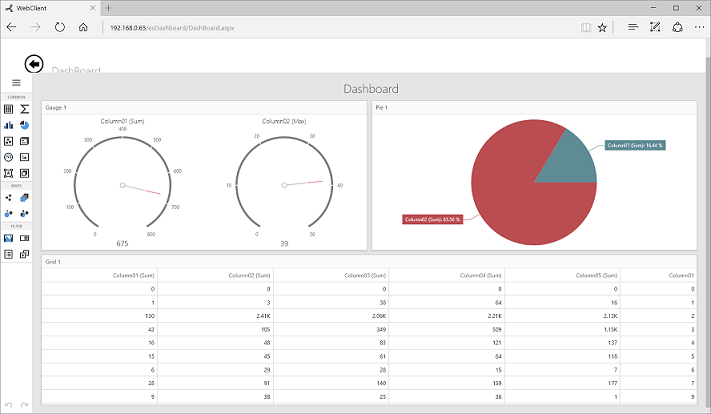
The option to create/edit new Dashboards has been included with the program's 3.1 version. By means of making a simple modification to the web.config file, as indicated in the examples below, new Dashboards can be created or the option allowing this can be disabled.
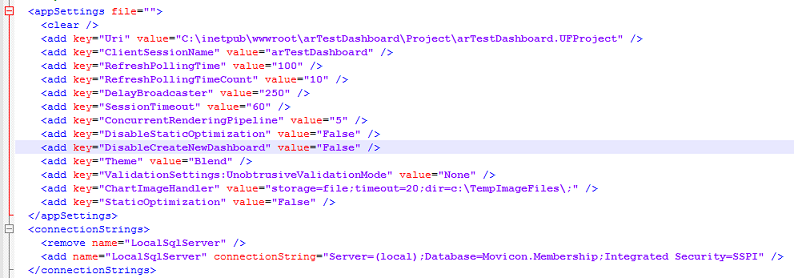
<add
key="DisableCreateNewDashboard" value="False" />
in this case it will be possible to create new dashboards
<add
key="DisableCreateNewDashboard" value="True" />
disables the possibility
to create new dashboards
![]()