Movicon.NExT Help on Line - Rel. 4.2.353
The WebHMI applications support GeoScada technology to allow browsers to display screens based on geographical maps with overlaying dynamic project information according to the features described in the chapter on GeoScada.
The Maps’ functionality is always configured in the WebHMI Server device by taking into consideration that you may also need to configure the system accordingly.
Maps managed in WebHMI up to version 4.1 are in vectorial format and should be downloaded, prepared, and installed on the server device as described below. This solution does not require an internet connection to a GeoMap services provider. local server systems can be used instead without needing to connect to GeoMap services providers.
In any case, an option to use internet connections to GeoMap service providers has been made available starting with version 4.2. and as with the Movicon.NExT Desktop version.
This solution offers more detailed maps which do not require any downloading or installation, but only an internet connection to the provider using an adequate bandwidth..
Vectorial Map Configuration for WebHMI
To customize vectorial maps in WebHMI you will need to:
Download an existing map of the areas available from https://download.bbbike.org/osm/ . If you cannot find the specific area you are looking for, try this other website https://extract.bbbike.org/ instead. You must download the selected area in OSM format.
The OSM file must be converted to the geojson format. This can be done in your PC or on-line. Please refer to the GDAL program manual for converting files off-line: https://gdal.org/download.html#current-releases. Below is an example of some commands used for converting the file:
ogrinfo <downloaded_file_name>.osm
This command returns the available layers within the file, such as:
Had to open data source read-only.
INFO: Open of `.osm'
using driver `OSM' successful.
1: points (Point)
2: lines (Line String)
3: multilinestrings (Multi Line String)
4: multipolygons (Multi Polygon)
5: other_relations (Geometry Collection)
ogr2ogr -f GeoJSON map_points.json < downloaded_file_name >.osm points
ogr2ogr -f GeoJSON map_lines.json < downloaded_file_name >.osm lines
ogr2ogr -f GeoJSON map_multilinestrings.json <downloaded_file_name>.osm multilinestrings
ogr2ogr -f GeoJSON map_multipolygons.json <downloaded_file_name>.osm multipolygons
ogr2ogr -f GeoJSON map_other_relations.json <downloaded_file_name>.osm other_relations
As an alternative, you can use an on line conversion service by first exporting the maps, for example, from “Openstreetmap” as “*.osm” files.
To edit the downloaded maps, install the QGIS software (https://www.qgis.org/en/site/forusers/download.html) to display and edit/filter the layers previously created in order to add a new layer (such as a grey background for example). When a filter is applied to a layer (such as “buildings” = ‘yes’), this layer can then be saved with a new name.
Copy the.json files to the webhmiserver’s wwwroot (C:\Program Files\Progea\Movicon.NExT x.x\WebHMIServer\wwwroot), and possibly in a subfolder like in our example: .../openstreetmap/
Edit the appsettings.json file within the C:\Program Files\Progea\Movicon.NExT 4.2\WebHMIServer path to use it and specify other parameters such as:
"WebNExTHMISettings": {
"Project": "",
"ProxyPath": "",
"LoginRequired": false,
"ShowDebugWindow": false,
"ForceMainPageAR": false,
"ARMappingProject": null,
"HttpListeningPort": 5000,
"HttpsListeningPort": 5001,
"MaximumParallelInvocationsPerClient": 5,
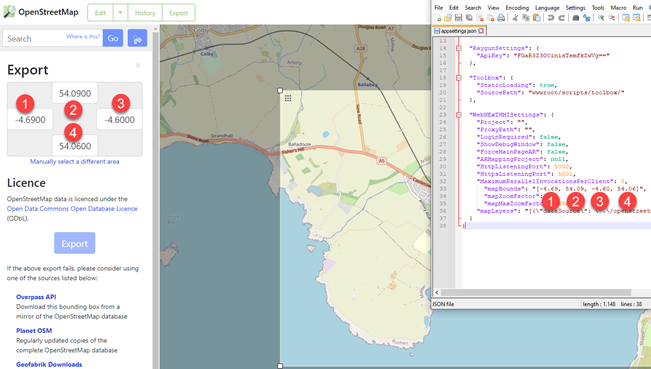
"mapBounds": "[-4.69, 54.09, -4.60, 54.06]",
"mapZoomFactor": 1,
"mapMaxZoomFactor": 256,
"mapLayers": "[{\"dataSource\": \".\/openstreetmap/landcover.json\", \"hoverEnabled\": false}, {\"dataSource\": \".\/openstreetmap/buildings.json\", \"hoverEnabled\": false},{\"dataSource\": \".\/openstreetmap/roads.json\", \"hoverEnabled\": false, \"label\": {\"enabled\": true, \"datafield\": \"name\"}}]"
}
}
These parameters are used to do the following:
• mapLayers: Allows you to declare a string array of the filename of the layer to be used.
• mapBounds: Allows you to define the geographical area displayed at startup.
Clicking on the export button will give you the possibility to display/edit the coordinates of the points that define the area to be exported. These points can be used within the configuration file to define the displayed area.
• mapZoomFactor: Specifies a number that is used as the intial map zoom factor.
• mapMaxZoomFactor: Specifies the maximum map zoom factor.
When finished, set the project’s “Startup Page Type” to Geo Page, and deploy the project using the project’s CreateWebHMI (SVG/HTML5) command.
Map Raster with connection to Services Provider configuration
Work in progress, available as from version 4.2
![]()